

Analytics and statistics#
Introduction#
The analytics resource records activity and monitors the state of SFTPPlus. It always starts with SFTPPlus and starts automatically if stopped when another component needs it. Its configuration is created automatically with UUID DEFAULT-ANALYTICS.
It collects the last login for each account across all configured services, including FTP, SFTP, and the Web Manager. This information is available as a Web Manager report. The resource stores file activity and metrics history in embedded SQLite databases for reports and dashboard graphs.
At the configured monitoring interval, the resource emits events containing usage counters. It also emits an event when resource usage reaches a configured limit. You can connect these events to an email-sender event handler to receive alerts by email.
For example, this analytics resource checks usage every two minutes and emits an event when more than 1000 connections are active:
[resources/DEFAULT-ANALYTICS]
name = Analytics Engine
type = analytics
monitor_interval = 120
connection_count_trigger = 1000
The resource also monitors configuration for upcoming expiration of certificates, PGP keys, accounts, and passwords. See Alerts and configuration monitoring for details and access rules.
Metrics history#
Service, location, transfer, and process metrics are sampled every 15 seconds and when the resource stops. The Web Manager dashboard shows totals recorded in the database file and activity for the last seven calendar days in the server's local time, including today. The configuration page for each service and location also shows its own connection and authentication activity alongside file activity and separate byte graphs for successful and failed operations in each direction. Active connections are shown as daily peaks and the highest recorded peak, rather than cumulative totals. Transfer pages show successful and failed files and bytes sent for that transfer. The comparison uses the preceding seven calendar days, ending at the same server-local time of day seven days ago. For example, at 14:30 today, the comparison excludes activity after 14:30 on the final day of the previous period. When the preceding period has no activity, a percentage increase is unavailable. Move the pointer over a day's chart area or focus a graph point with the keyboard to see its date and value.
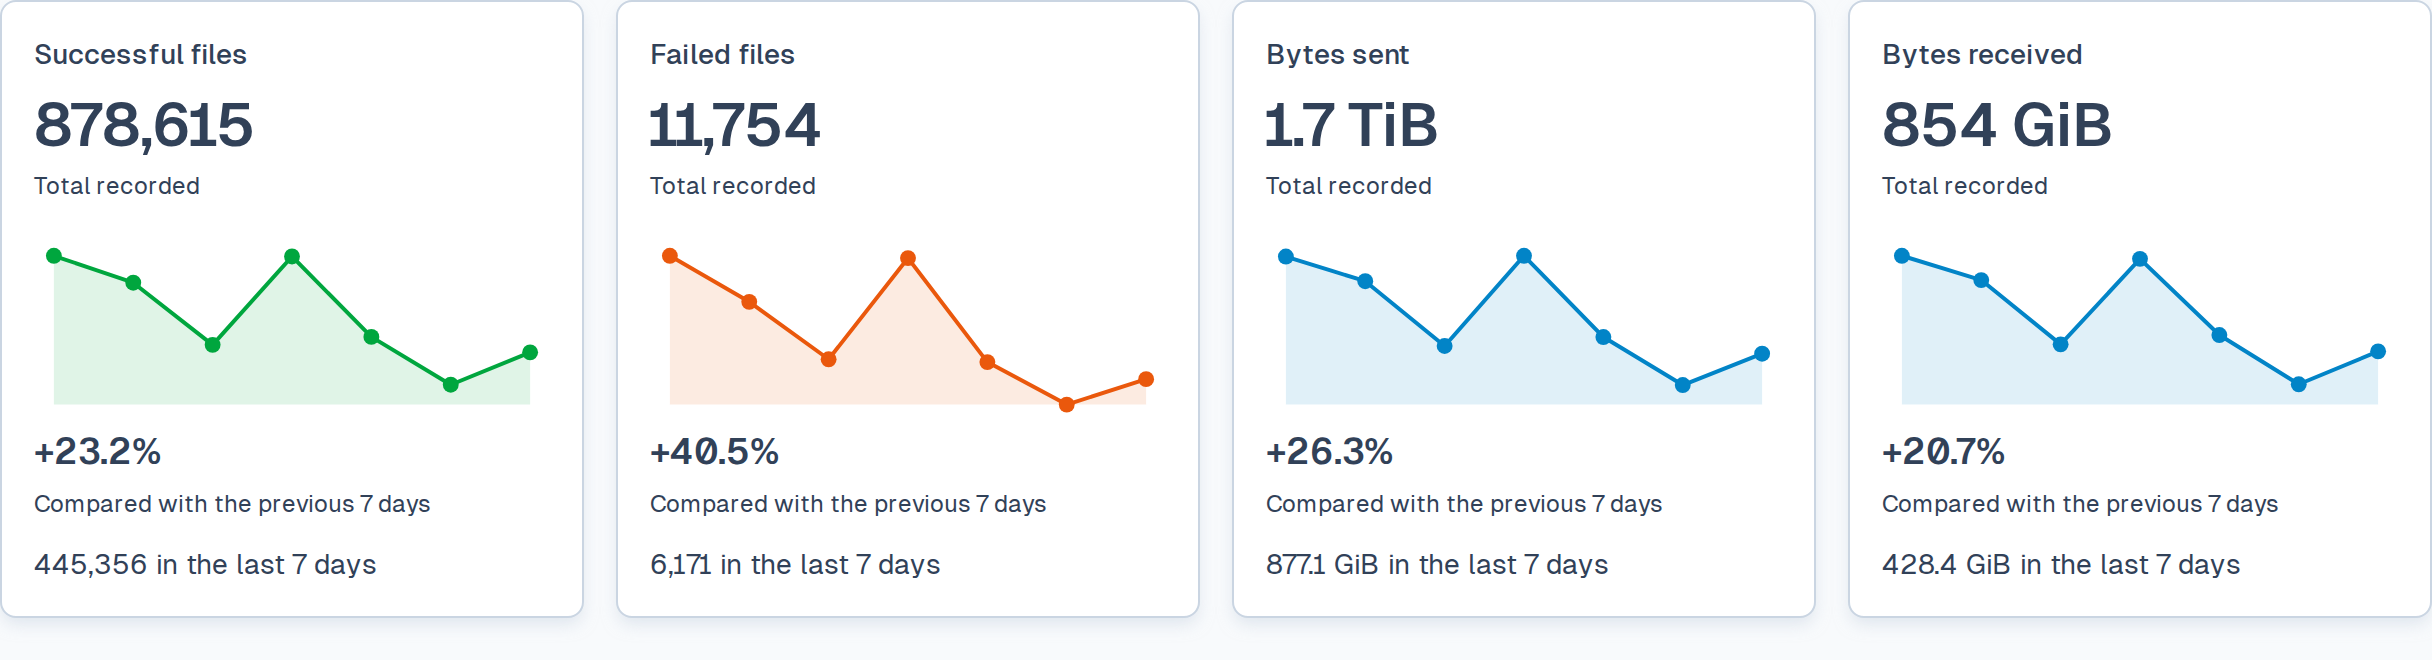
Recorded activity in the Web Manager dashboard.#
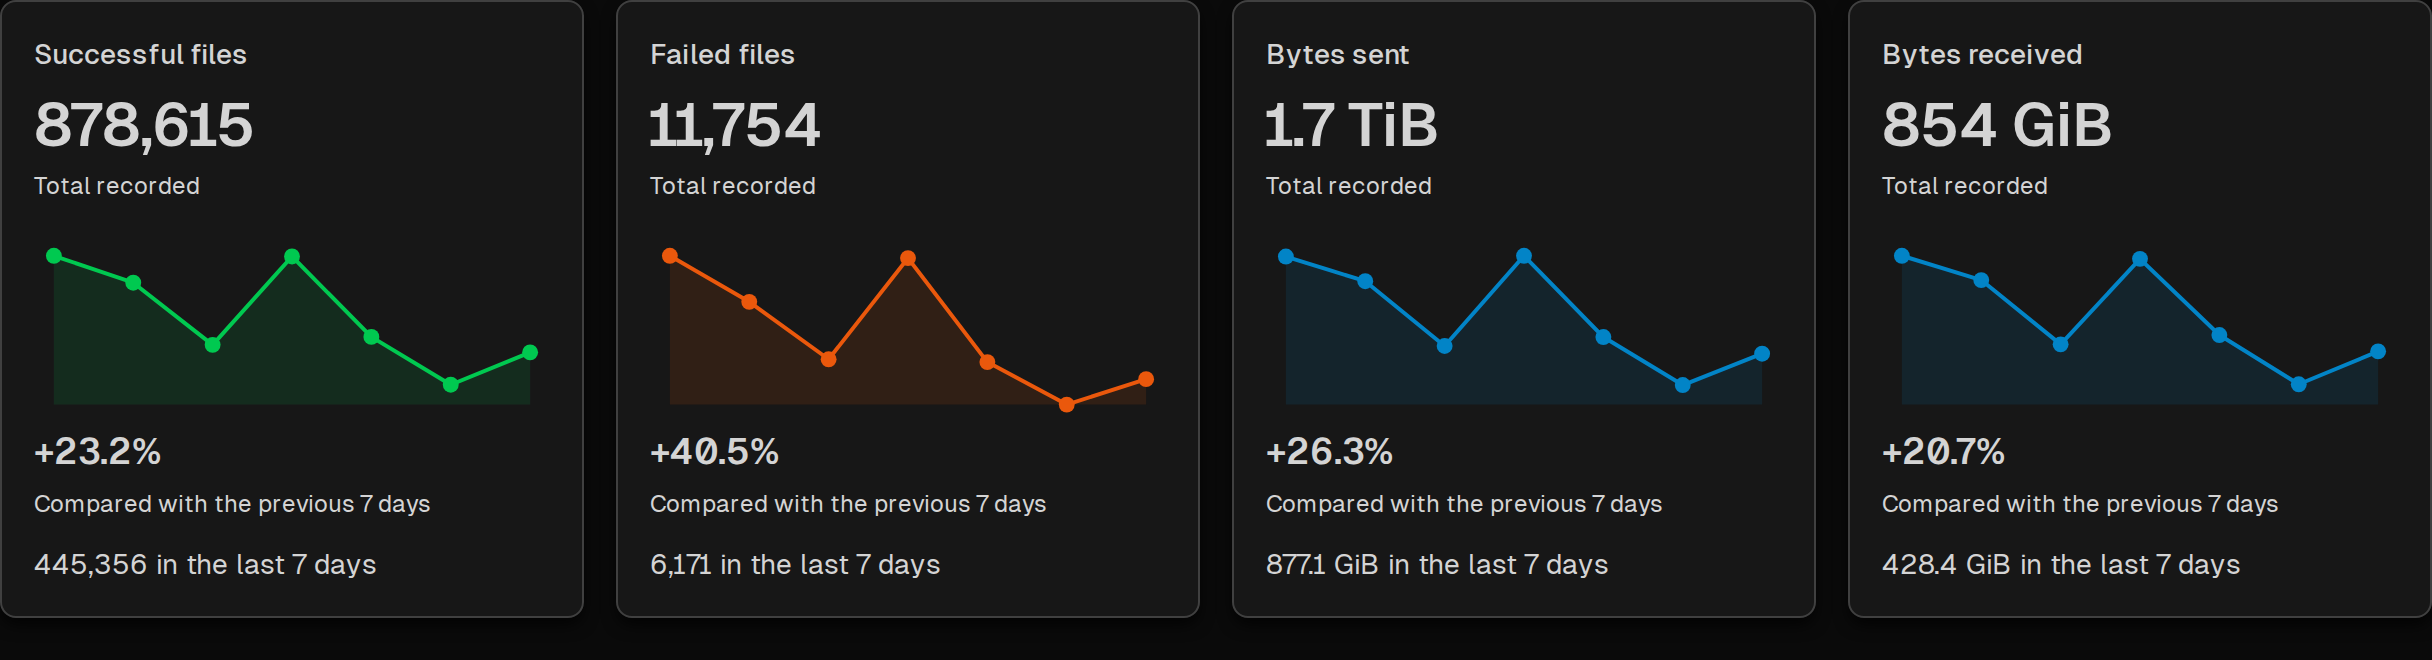
Recorded activity in the Web Manager dashboard.#
Dashboard totals count operations recorded by services and locations. By default, these metrics samples are stored in log/analytics.sqlite in the SFTPPlus installation's log folder. The database file is automatically kept between upgrades. It uses the SQLite format and can be backed up or used by third-party tools for custom analytics.
The built-in analytics database is intended for standalone SFTPPlus installations. If SFTPPlus is already integrated with Prometheus and Grafana, set metrics_database_path to disabled to avoid local history sampling and database writes, reducing processing and disk overhead. This disables the built-in metrics history while leaving Prometheus metrics and the other analytics resource functions available. The Web Manager hides the activity graphs while local history is disabled.
activity_database_path#
- Optional:
Yes
- Default value:
configuration/activity-records.db3
- Values:
Path to a file on the local filesystem.
- From version:
6.3.0
- Description:
The SQLite database file used to store login and transfer activity, including records used to prevent duplicate transfers. Relative paths are resolved from the SFTPPlus installation directory. The parent directory must exist and be writable by the SFTPPlus service account. SFTPPlus creates the database file if it does not exist.
Restart the analytics resource after changing this option. To retain existing activity records when moving the database, stop SFTPPlus, move the file, update this option, and start SFTPPlus again.
monitor_interval#
- Default value:
60
- Optional:
No
- Values:
Number of seconds
- From version:
3.44.0
- Description:
Time interval, in seconds, between system checks.
This value is only used by analytics functionality that requires constant monitoring. For example, checking the resource usage or auto-disabling of inactive accounts.
Login date, time, and transfer activity is recorded in real time.
For production environments we recommend setting a value equal to or greater than 60 seconds. Lower values may impact the overall performance of the system.
memory_resident_trigger#
- Default value:
0
- Optional:
Yes
- Values:
Number of bytes
0
- From version:
3.44.0
- Description:
Amount of resident / non-swapped physical memory used by SFTPPlus, in bytes, for which to emit an exception event if its process is using more than the configured value.
On Windows, it matches the Mem Usage column of the task manager. On other OSes, it matches the RES column of the top command.
Leave it to 0 to disable triggering an event based on the usage of this resource.
memory_virtual_trigger#
- Default value:
0
- Optional:
Yes
- Values:
Number of bytes
0
- From version:
3.44.0
- Description:
Total amount of virtual memory used by SFTPPlus, in bytes, for which to emit an exception event if its process is using more than the configured value.
This includes both physical memory and swapped memory.
On Windows, it matches the VM Size column of the task manager. On other OSes, it matches the VIRT column of the top command.
Leave it to 0 to disable triggering an event based on the usage of this resource.
connection_count_trigger#
- Default value:
0
- Optional:
Yes
- Values:
Number
0
- From version:
3.44.0
- Description:
Total number of connections (server-side and client-side) used by SFTPPlus for which to trigger an exceptional event.
This includes the following connection categories: * Incoming connections made to file transfer services * Outgoing connections made to remote servers through configured transfers * Syslog / HTTP Authentication / HTTP Event Handlers connections * Connections made to the Web Manager service.
Leave it to 0 to disable triggering an event based on the usage of this resource.
file_count_trigger#
- Default value:
0
- Optional:
Yes
- Values:
Number
0
- From version:
3.44.0
- Description:
Total number of local files used by SFTPPlus for which to trigger an exceptional event.
This includes all files opened by SFTPPlus as part of file transfer operations or for administrative operations.
For example, log files used by event handlers are included in this count.
A single connection can trigger the opening of multiple local files.
Leave it to 0 to disable triggering an event based on the usage of this resource.
thread_count_trigger#
- Default value:
0
- Optional:
Yes
- Values:
Number
0
- From version:
3.44.0
- Description:
Total number of threads used by SFTPPlus for which to trigger an exceptional event.
Take into consideration that multiple transfers can use the same thread.
Leave it to 0 to disable triggering an event based on the usage of this resource.
certificate_expiration_warning#
- Default value:
21
- Optional:
Yes
- Values:
Number of days
0
- From version:
5.15.0
- Description:
A warning is generated in Web Manager and an event is emitted if SFTPPlus is configured with a certificate that is about to expire in less than the configured number of days.
Set it to 0 to disable triggering these alerts.
See Certificate and PGP key expiration warnings for details about the checks and the certificates they cover.
account_expiration_warning#
- Default value:
21
- Optional:
Yes
- Values:
Number of days
0
- From version:
5.24.0
- Description:
An event is emitted if an account is enabled and is configured to expire in less than the configured number of days.
No event is emitted for accounts that don't have an expiration date configured or which are already expired.
This is configured as number of days.
This is checked once per day, at midnight, and when SFTPPlus starts.
Set it to 0 to disable triggering these alerts.
See Account and password expiration warnings for details about the checks and administrator access.
password_expiration_warning#
- Default value:
14
- Optional:
Yes
- Values:
Number of days
0
- From version:
5.24.0
- Description:
An event is emitted if an account is enabled and is configured with a password that is about to expire in less than the configured number of days.
No event is emitted when the password is already expired.
This is configured as number of days.
This is checked once per day, at midnight, and when SFTPPlus starts.
Set it to 0 to disable triggering these alerts.
See Account and password expiration warnings for details about the checks and administrator access.
account_auto_disable_grace_interval#
- Default value:
7
- Optional:
Yes
- Values:
Number of days
- From version:
5.15.0
- Description:
Number of days to delay auto-disabling of an inactive account, based on date it was last changed.
Inactive accounts are accounts that don't have successful logins, in the time interval configured for each account or each group using the disable_on_inactivity configuration option.
For example, when an account is auto-disabled, you can manually re-enable the account and the account_auto_disable_grace_interval is the interval for which the account remains active. If no successful logins are performed in the grace interval, the account will be auto-disabled again.
This configuration is also used for accounts that don't have any login records at all. For those accounts, the account configuration changed date is used as the base for the grace period.
This should be configured with a value equal or greater than 1 day.
It is recommended to configure it to a value smaller than the one configured for the disable_on_inactivity option set for accounts or groups.
metrics_database_path#
- Default value:
log/analytics.sqlite
- Optional:
Yes
- Values:
Local file path
disabled
- From version:
6.1.0
- Description:
File used to store sampled service, location, transfer, and process metrics. Set to disabled to turn off the local analytics database. Relative paths start in the SFTPPlus installation folder. The parent folder must exist and be writable by SFTPPlus.